How do the updated International Poverty Lines affect poverty measurement? >
Many of us rely on the International Poverty Line as a global standard for measuring poverty and targeting services. In 2022, the World Bank’s Development Data Group introduced new International Poverty Lines (IPLs), re-defining each IPL using 2017 Purchasing Power Parity (PPP) values instead of the older 2011 values. The three lowest lines, set to $1.90, $3.20, and $5.50 USD per person per day in 2011 PPP terms, have been revised to $2.15, $3.65, and $6.85. Overall, the World Bank staff have worked hard to make these new definitions as comparable as possible to the previous ones, while also making important updates to the methods used. Even so, this update highlights some important new facts about how the definition and prevalence of global poverty have changed, particularly for Sub-Saharan Africa—the world’s poorest region—.
You can find detailed explanations of the transition in a blog post, a working paper, and an FAQ factsheet, all by the World Bank. In this entry, the Poverty Probability Index (PPI) team at IPA will try to highlight the most important details for organizations that report against international poverty standards, and what it means for those who are using the PPI.
How are these poverty lines derived?
To understand what’s changed, it may help to look at how the value of each poverty line was derived. Importantly, international poverty lines have historically been set by reference to national poverty lines in poor countries. Since 2005, the extreme poverty line was calculated using the average national poverty line of 15 of the lowest-income countries of the 1990’s. This most recent update includes some important methodological improvements,[1] but the principle remains the same that national standards for poverty are used as a guide. Unlike in previous rounds, the higher lines ($3.65 and $6.85) were derived following the same methodology—using the median harmonized poverty lines from 54 lower-middle and 37 upper-middle income countries (more on that later)—.
What hasn’t changed?
In the past, updates to PPP-adjusted international poverty lines have resulted in significant changes to global and regional poverty estimates, raising concerns both within and outside the Bank that the updated definitions were “moving the goal posts” for agencies working towards international development goals. In response, stability was a major consideration in this round of updates, especially with the lowest International Poverty Line (IPL) of $1.90 per person per day in 2011 PPP terms.
As such, moving to $2.15 with the 2017 PPPs was designed to be a nominal increase, with the real value remaining virtually the same. The World Bank was quick to emphasize that “the real value of the international poverty line is virtually unchanged—it is simply expressed in different prices now.” While the 2017 PPPs reflect changes in the purchasing power of consumers in each country, the new $2.15 value was not driven by increases in the national poverty lines of low-income countries. In fact, global poverty rates haven’t changed much either. For example, the global extreme poverty rate saw a decrease of only 0.2pp, from 9.3% to 9.1% (see Table 1).
What has changed?
While the update hasn’t changed the global estimates for the $2.15 line, a closer look reveals a few places where poverty rates see non-trivial changes. Two particularly important points are worth noting:
- Specific countries may see significant changes.
These updates can have much higher effects at the regional level. It has an important effect for Sub-Saharan Africa—still the world’s poorest region—where the new line takes approximately 34 million out of extreme poverty, mainly due to increased purchasing power in some poor countries in recent years. These changes will often be even larger when looking at specific countries. - Changes in poverty rates are larger for higher poverty lines.
For the higher 2017 PPP lines, especially the $6.85 standard, there is a significant increase of people living under this upper-middle poverty line relative to the previous $5.50 value in 2011 PPPs. This change was driven largely by increases in the national poverty lines of upper-middle income countries,[2] rather than changes in purchasing power. This means the World Bank just followed upper middle-income countries in raising the standards by which people are considered to be poor at this level.
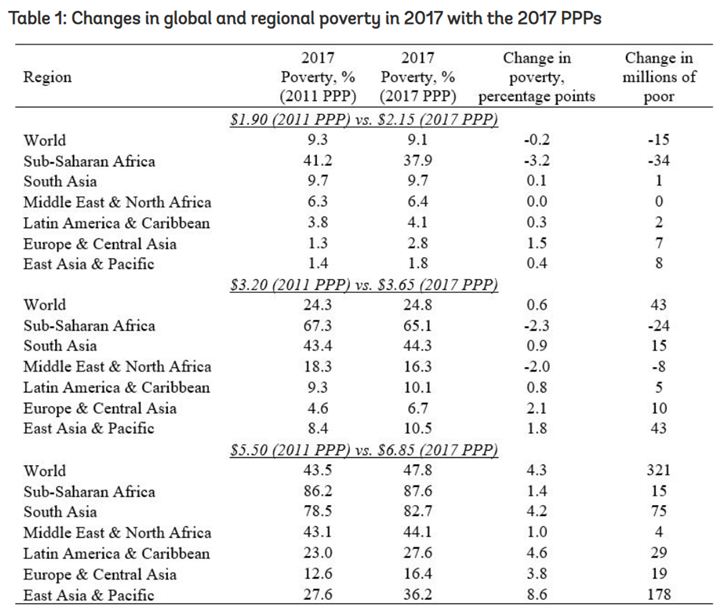
Source: World Bank
The cases of Sub-Saharan Africa and East Asia & Pacific can prove useful to understand how the new international poverty lines might affect PPI estimates. While this adjustment is largely just about expressing the same kind of poverty using updated prices values, the nominal increase of the poverty line does not necessarily mean that more people will fall below it. As the table above illustrates, these two regions have notably different effects at each line, with Sub-Saharan Africa doing better—in relative terms—because of a substantial increase in their purchasing power.
What does this mean for the PPI?
Since the World Bank’s update in September, PPI users from around the world have asked us how this will affect PPI-based poverty estimates in their organizations. We think a few key lessons have emerged:
- It is still completely valid to use 2011 PPP values for poverty measurement.
The most common question has been “Do we have to switch to using 2017 PPP poverty lines?“ A change like that can be especially inconvenient if an M&E department has been collecting data and reporting against the same standards for years. Fortunately, the 2011 PPP metrics are just as meaningful as they were before and can continue to be meaningfully used. While we recommend updating eventually, the PPI tools will continue to include 2011 PPP lines for the next few years, allowing users time to make a complete transition to the 2017 PPP lines. - Some countries will experience non-trivial changes when updating to the 2017 PPP lines.
Despite all the work done to avoid “moving the goalposts,” the new and old poverty lines are meaningfully different. This means that when using updated values, PPI users will usually see changes in the underlying poverty rate that they should expect among the community. On average, these changes will be relatively small, but some countries may see non-trivial increases, especially when using higher lines like the $6.85 standard. New PPI scorecards will contain both 2011 and 2017 lines, so users will be able to compare the different values and be well informed as to what these updates mean for their clients. - New poverty metrics require new outreach goals and benchmarks.
Organizations that set internal goals and benchmarks for poverty outreach have to update these in parallel with their data collection efforts. For example, an organization that has used the $3.20 line for years can’t simply replace it with the $3.65 line without first checking whether these two lines yield similar results in their context. To help with this, new PPI scorecards will always report sub-national poverty rates for both 2011 and 2017 PPP values, but the most relevant estimates will typically come from your organization’s own internal data. Historical PPI data can be re-calculated as soon as updated PPI scorecards are published at povertyindex.org to guide these updates.
For more advice or support as you navigate this process, please feel free to reach out to us at ppihelpdesk@poverty-action.org
References
https://www.povertyindex.org/blog/transitioning-new-2011-ppp-lines
https://blogs.worldbank.org/voices/adjustment-global-poverty-lines
https://blogs.worldbank.org/opendata/updating-international-poverty-line-2017-ppps
[1] Outlined in Jolliffe and Prydz (2016).
[2] This according to the Jolliffe and Prydz (2016) methodology.