How to Select a Poverty Line or Lines for Analysis >
To make it easy to assess and compare the consumption-based welfare of different beneficiary groups, we construct multiple poverty lines for each PPI. Each poverty line is associated with a distinct definition of household poverty and may be relevant to a specific use and context. This blog explains how organizations can select appropriate poverty lines for their purpose.
(Note: This blog post is the fourth installment of the PPI Practitioner Guidance Series. For more information, read the first installment on setting poverty outreach goals, the second installment on transitioning to the new 2011 PPP lines, and the third installment on five common errors to avoid when using the PPI.)
The PPI computes the probability that a household is below a poverty line, i.e. the probability that the household’s per-person (or per adult-equivalent)/per-day income or consumption expenditure is below a poverty line [1]. You should compute the poverty likelihoods of individual households and then average them in order to obtain the poverty rate of a group of households, i.e. the share or proportion of households in the group that are below that poverty line.
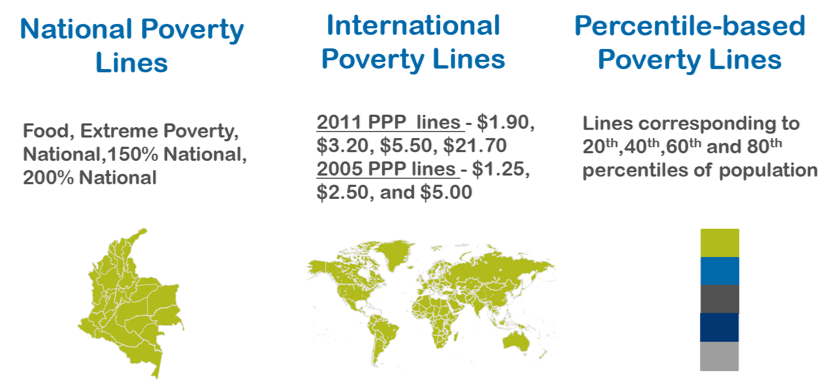
We typically provide the following poverty lines with every PPI, though this list may vary slightly from country to country [2].
|
These are measures of a country’s own estimation of the minimum income or expenditure that is consistent with an adequate standard of living in the country [3]. |
These are global poverty benchmarks determined by the World Bank. The $1.90/person/day 2011 Purchasing Power Parity (PPP) line is the World Bank’s current definition of extreme poverty [4]. |
These lines provide a measure of the income or consumption expenditure corresponding to the 20th, 40th, 60th and 80th percentiles of the national population. |
Given that multiple poverty lines are provided with the PPI, how should you decide which poverty line is most appropriate for your purpose? This is an important question since the choice of poverty line is the very first step in PPI data analysis [5].
Here are a few considerations which can help you answer that question:
1. What is the type of beneficiary that your organization is serving?
One way to select a poverty line for analysis is to look at the profile of the beneficiaries that you are serving, or the kind of intervention that your organization is making to improve the lives of the poor. For example, if your organization is working with ultra-poor populations, then lower poverty lines such as the Food or Extreme Poverty Line, the $1.90/day 2011 PPP line, or the 20th percentile line are appropriate [6]. On the other hand, organizations working with low to middle-income populations within a country may opt for higher poverty lines such as the $5.50/day 2011 PPP or the 40th or 60th percentile lines.
2. What kind of poverty rate comparisons are you making?
Absolute Poverty Rate Comparisons
Absolute poverty is measured against a set, objective standard which allows for comparisons across countries. The $1.90/person/day 2011 PPP line is the World Bank’s current definition of extreme poverty. An organization which operates in two different countries can use this poverty line to determine in which country it is reaching a greater share or number of poor households living in extreme poverty (i.e., below the minimum income or expenditure level that is considered sufficient to meet a household’s basic needs), in absolute terms. Note that higher or lower poverty lines may be more appropriate depending on the country. For example, for low-middle income countries (e.g., India), the $3.20/day 2011 PPP line is designed to be a relevant measure of poverty. For upper-middle income countries (e.g., Peru) the $5.50/day 2011 PPP line is considered to be the most appropriate.
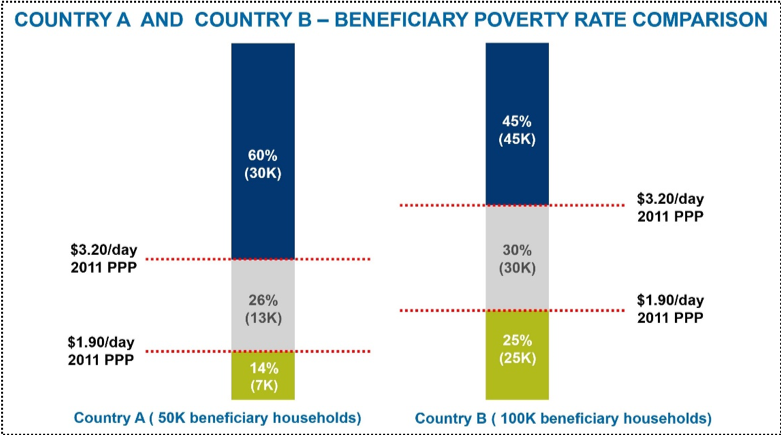
For example, look at Figure 1, below. This chart [7] represents the poverty rate of an organization’s beneficiaries across two poverty lines—the $1.90/day and $3.20/day 2011 PPP lines—in two countries.
Figure 1
Data from this chart is presented in the simple table below.
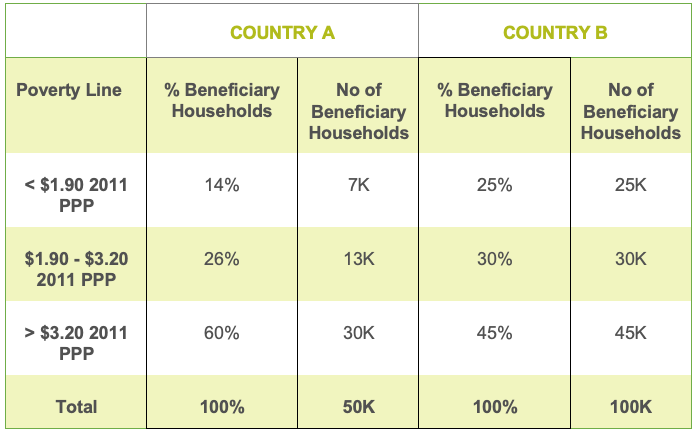
The organization has 50K beneficiary households in country A, and 100K beneficiary households in country B. The figures in brackets in the chart represent the number of beneficiary households in each poverty segment. Thus, 7K beneficiary households (14% * 50K households) are below the $1.90/day 2011 PPP line in country A.
This chart thus allows the organization to infer that its absolute poverty outreach—both in terms of share and percentage of poor households reached—is higher in country B than in country A. This is irrespective of which international poverty line is being considered for analysis ($1.90/day 2011 PPP or $3.20/day 2011 PPP).
Thus, you should use international poverty lines for absolute comparisons across countries, and the national poverty line for absolute comparisons within a country.
Relative Poverty Rate Comparisons
Relative household-level poverty is measured against other households rather than against an absolute standard. A household may be well above the extreme poverty line but could still be relatively less well-off when compared to other households in the country who have a higher standard of living. The percentile-based poverty lines provided through the PPI provide a measure of the income or consumption expenditure corresponding to the 20th, 40th, 60th, and 80th percentiles of the national population, allowing you to make these relative comparisons.
For example, consider the chart [8] in Figure 2 below. Assume that an organization runs two programs in a country: a financial services program and a health services program.
Figure 2
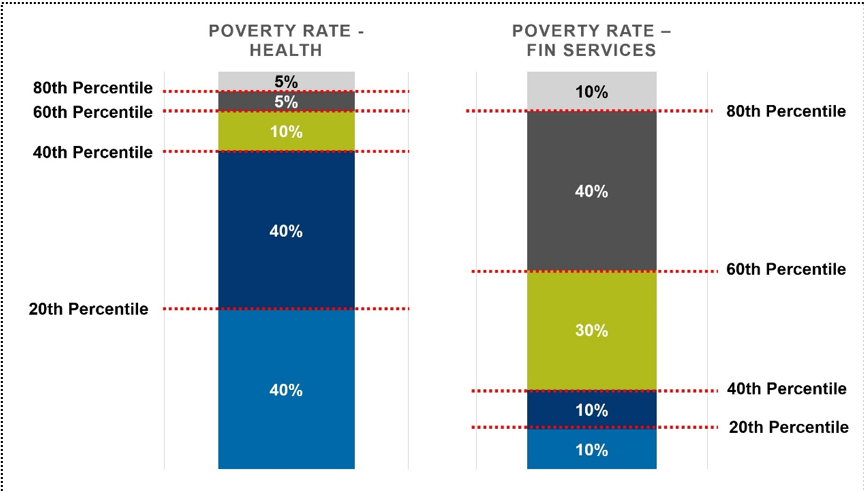
Looking at Figure 2, it becomes clear that 80% of the health program’s beneficiaries are in the two poorest quintiles: below the 20th percentile line, and between the 20th and 40th percentile lines. On the other hand, only 20% of the financial services program’s beneficiaries lie in the two poorest quintiles. The health program thus serves a relatively more poor population as compared to the financial services program.
Percentile-based lines are thus appropriate when making relative comparisons within a country or across multiple countries.
3. Does your organization define adequate living standards by national or international standards?
National Poverty Lines are measures of a country’s own estimation of the minimum income or expenditure that is consistent with an adequate standard of living in that particular country. The international poverty lines, on the other hand, are globally-accepted economic thresholds below which households are considered to be living in poverty. The World Bank has currently defined these thresholds as $1.90/day 2011 PPP for the poorest countries, $3.20/day for lower-middle income countries, $5.50/day for middle-high income countries, and $21.70/day 2011 PPP for high-income countries.
If your organization wishes to rely on a country’s own determination of poverty thresholds, National Poverty Lines are appropriate for you. If you prefer a global definition of poverty that is consistent across countries which are in a similar stage of development, you should consider using the International Poverty Lines instead.
Additional Resources
We hope that this blog helps demystify poverty lines and assists you to select one or more lines that are appropriate for your purposes. For more information, be sure to check out other Learning Materials and Resources on our website.
Note that different poverty lines—which may be higher or lower lines than what may be provided with the publicly available version of the PPI provided on our website—are useful for specific applications. In addition, the preferred types of questions (e.g., ownership of assets, consumption of certain food items) and the length of the PPI questionnaire may vary according to different user needs. We provide custom PPIs for these other applications. If you are interested in creating a custom PPI or have any questions, please feel free to reach out to us at ppihelpdesk@poverty-action.org.
If you would like to share your thoughts and experiences with selecting an appropriate poverty line that is suitable for your organization’s work, please comment below. We’d love to hear from you.
[1] Depending upon whether the national household survey that the PPI is based on measures income or expenditure.
[2] Please refer to section 1 “Using the PPI” in your country’s PPI User Guide to see the list of poverty lines that PPI is calibrated to.
[3] The minimum income or expenditure is adjusted for household size and composition, and differences in local prices within a country.
[4] Households in a country that cannot afford to consume the equivalent basket of goods and services that a household in the United States can consume (per person) with a daily expenditure of 1.90 U.S. dollars in 2011 are considered to be in extreme poverty.
[5] As an example, please refer to Section 1B) on Pages 4-5 of the User Guide for Kenya’s 2015 PPI to see how to measure poverty rates using the PPI.
[6] The Food Poverty Line and Extreme Poverty Line are defined only by some countries and hence may not be available with all PPIs.
[7] For illustrative purposes only
[8] For illustrative purposes only
- Inicie sesión o regístrese para comentar