Announcing Our New and Improved PPI Construction Methodology >
Since Innovations for Poverty Action (IPA) became the new home of the PPI in 2016, IPA has proven to be an excellent fit for further scaling the PPI, as we are able to tap into its survey and data quality expertise in country offices around the world. Over the past year, we have made great progress towards our objective of having a long-term sustainable model for the tool, including a technical team and scorecard development capacity that is institutionalized at IPA. We have undertaken a brand refresh, and changed the name of the tool from "Progress out of Poverty Index" to "Poverty Probability Index" to better reflect what the tool does.
In line with our commitment to continual improvement, where our core business is rigorous data and evidence and the creation of public goods, we have updated the methodology behind the development of the PPI.
What is not changing?
From a user’s perspective, the PPI is fundamentally the same. The PPI will continue to have 10 questions, a scoring system, and look-up tables that convert scores to poverty likelihoods, which can be used to calculate a group poverty rate. Existing PPIs remain valid and will be supported by the PPI Help Desk. However, the new methodology will be used to create new PPIs, and update existing PPIs from this point on. You can see the PPIs that are currently slated for development on our website here.
What is changing?
1. Model sustainability and improved sub-national accuracy
In order to achieve long-term sustainability of a tool that is relied upon by hundreds of organizations globally, we have designed a new methodology and code to create the tool. The method is based on established statistical learning techniques and provides users with the added assurance that it has been reviewed by experts. Since the field is rapidly evolving, we will refine the model on an ongoing basis. The new PPI is also designed to provide more accurate results when applied to sub-national regions for which data is available separately in the national survey.
2. Poverty likelihood for every PPI score
Rather than providing a single poverty likelihood value for a bucket of 5 PPI scores, the look-up tables now report probabilities for individual PPI scores. This added level of granularity permits you to track changes in poverty for smaller improvements in PPI scores.

3. Different points for indicators based on poverty line used
The ability of an individual PPI indicator to distinguish between poor and non-poor households may vary across poverty lines. The new PPI provides different points for responses to the same indicator, depending on the poverty line considered. Thus, the “weight” of an indicator in the final PPI score will vary depending upon the poverty line being used.

4. User-friendly product guide
We have redesigned the PPI design documentation. It is now simpler, easier to read, and focuses specifically on what you really want to know — how to use this PPI to calculate poverty rates, target poor households, and estimate changes in poverty rates over time.

5. Data analysis support
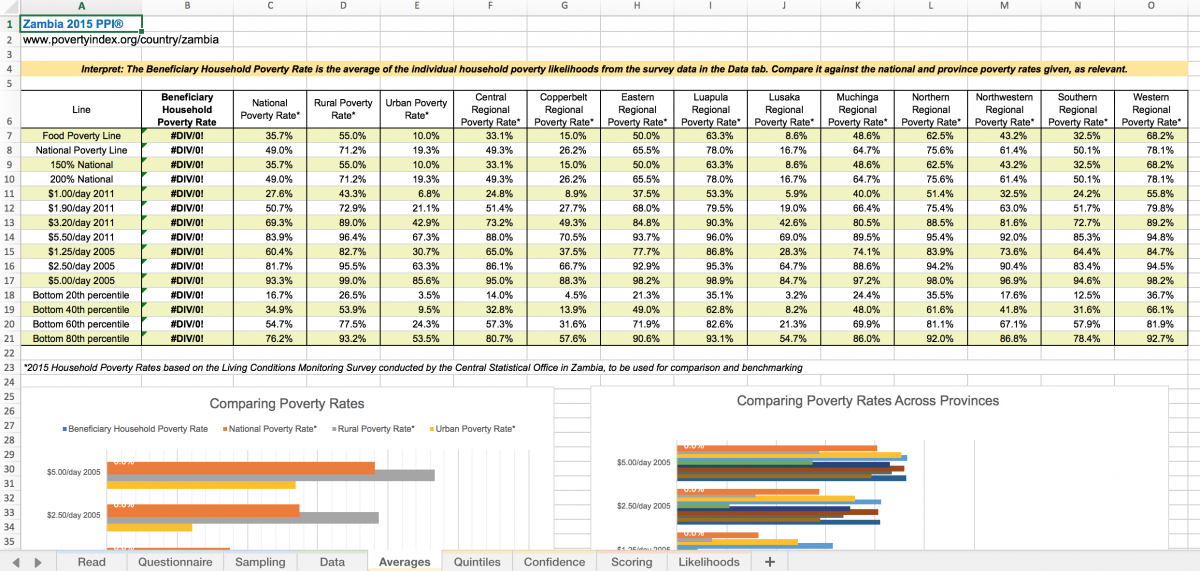
Each country-specific PPI now comes with its own Excel-based data analysis tool. Simply enter responses provided by your beneficiaries to the PPI questionnaire here. The tool will automatically compute poverty likelihoods and rates for all poverty lines to which the PPI is calibrated.
Please refer to these FAQs for more details on the new and improved PPI construction methodology.
We look forward to working with you all to roll out and use the new and improved PPI. As always, if you have any questions, please use our Help Desk or email us at ppi@poverty-action.org.